SIA M&E Platform — User Guide
A complete walkthrough of the Monitoring & Evaluation platform — from creating your organisation account to tracking indicators and generating reports.
Platform Flow
Registration
Create your organisation account on the SIA MIS Platform
New organisations register at /register. The registration form captures organisation details, contact info, address, and billing plan. On successful submission an account-verification email is sent with login credentials.
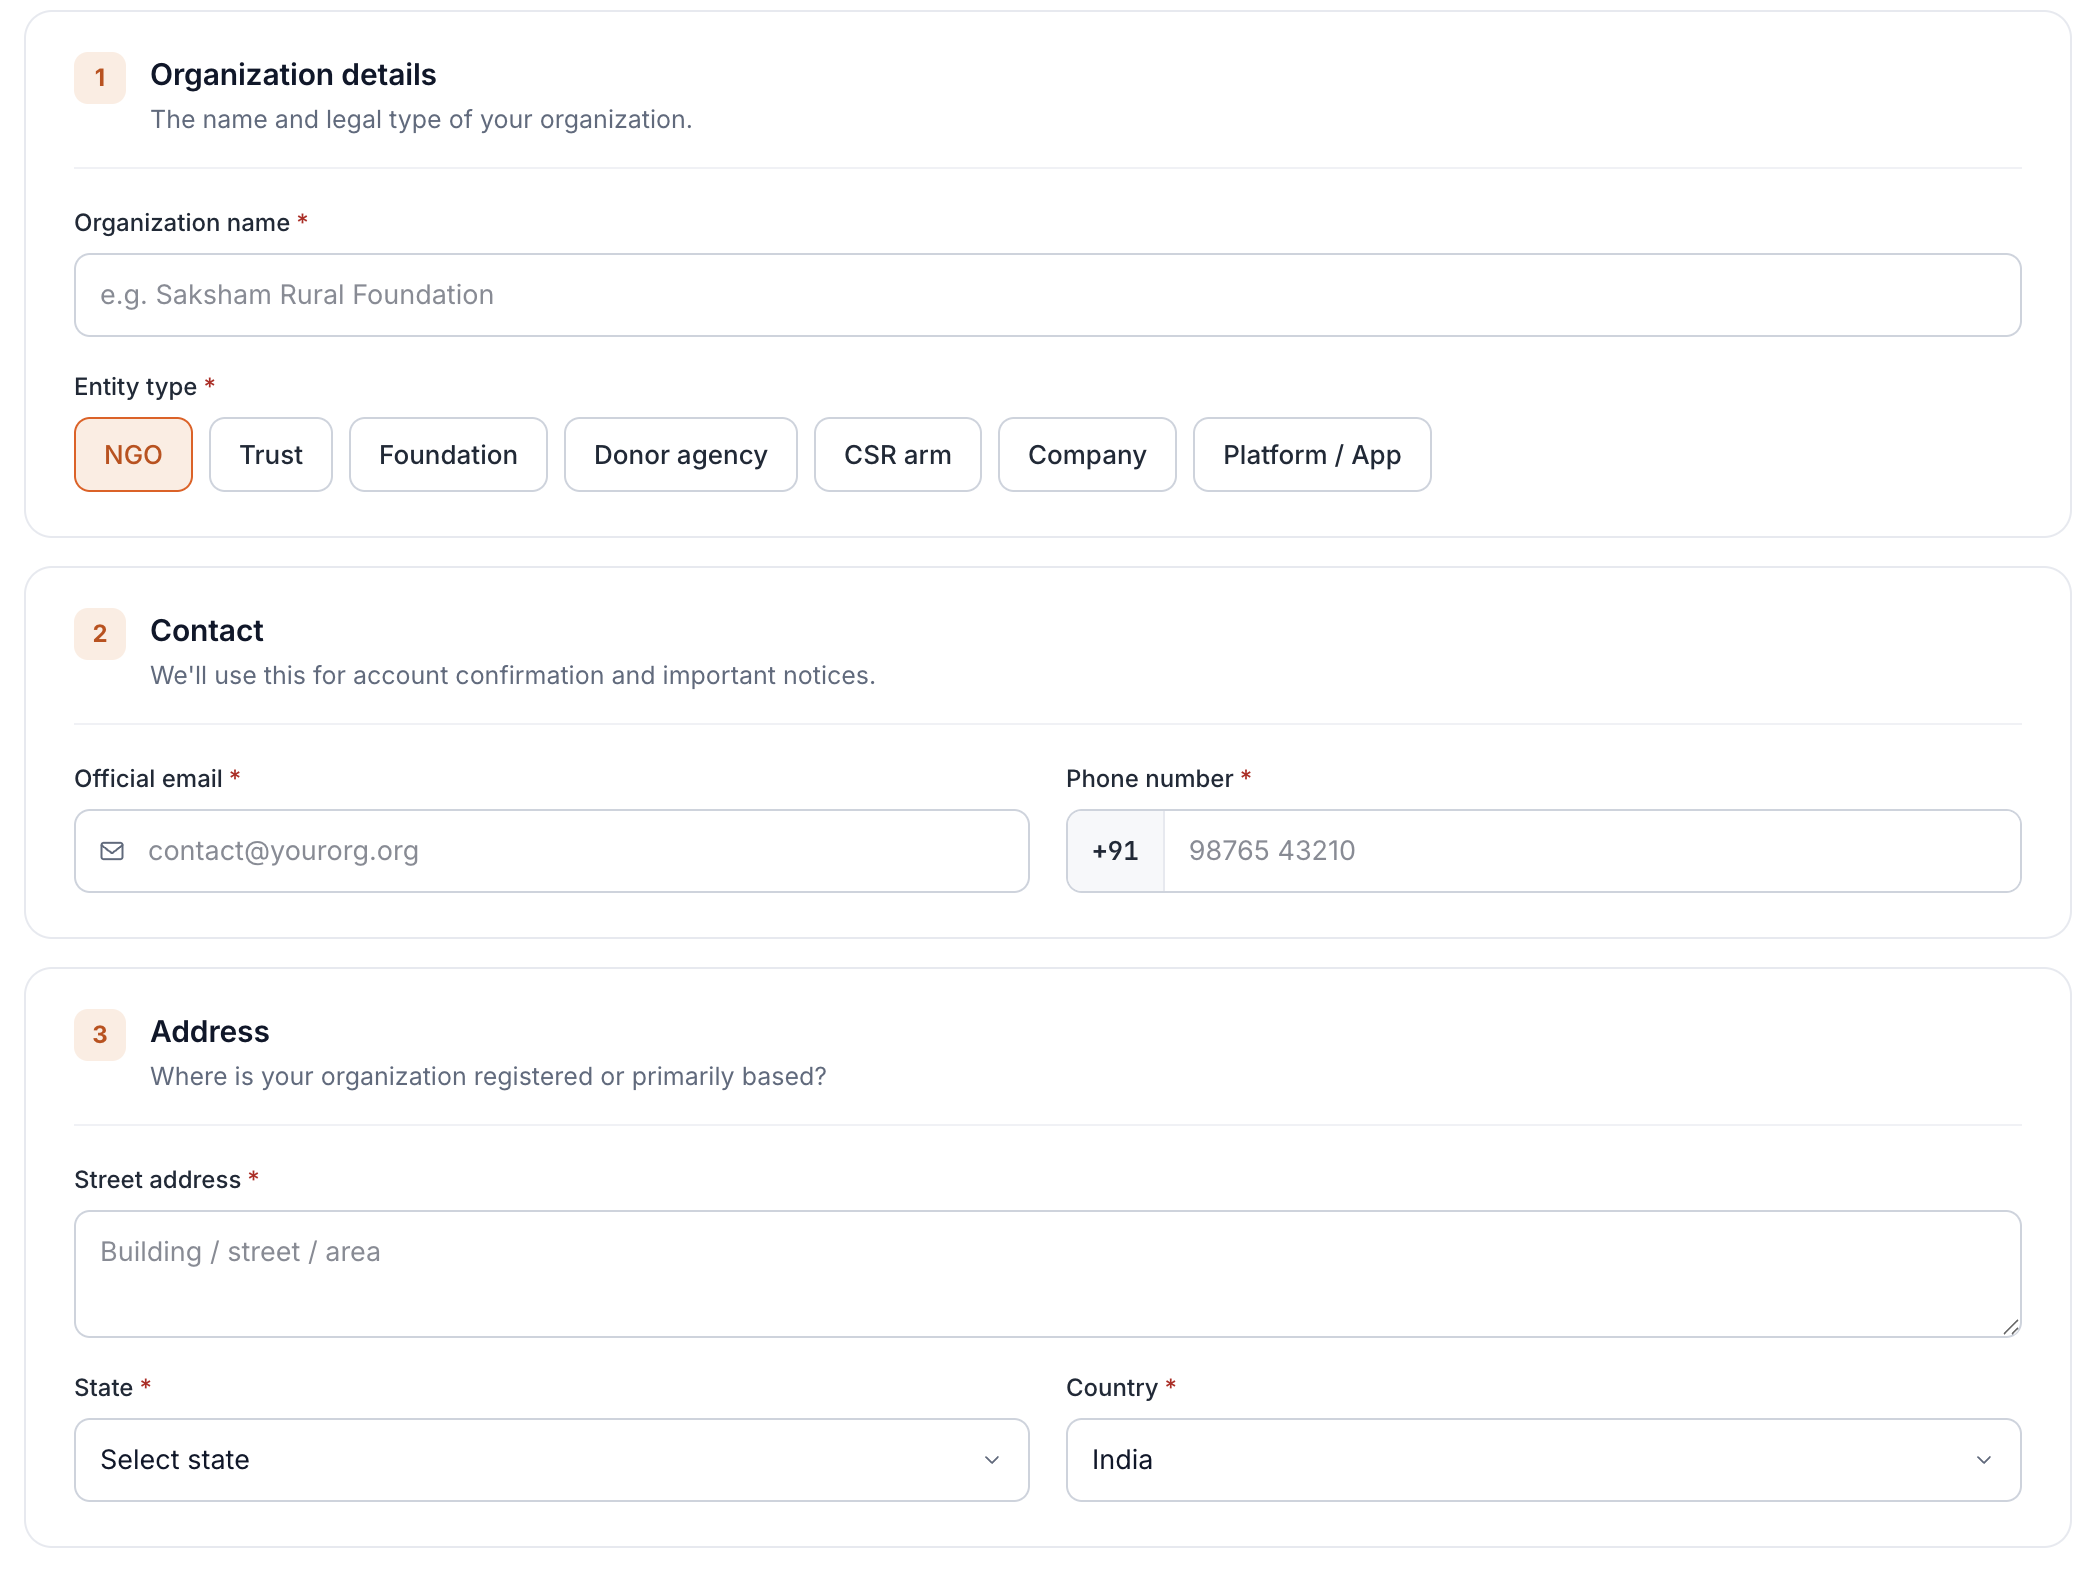
Organisation Details
| Field | Type | Description |
|---|---|---|
| Organisation Name* | Text | Legal name of the organisation. |
| Entity Type* | Select | Type of organisation: NGO, Trust, Foundation, Donor agency, CSR arm, Company, Platform, or App. |
| Official Email* | Primary contact email for the organisation. | |
| Phone Number* | Tel | Mobile or landline with +91 country prefix. |
Address
| Field | Type | Description |
|---|---|---|
| Street Address* | Text | Building number, street, and locality. |
| State* | Select | Indian state or territory. |
| Country* | Select | Country (defaults to India). |
Billing Plan
Choose a subscription plan (all plans billed annually):
1 project · 6-month full-feature trial.
Up to 5 projects · Core M&E features for small NGOs.
Up to 10 projects · Advanced reporting & analytics.
Unlimited projects · Full feature suite, priority support.
Login
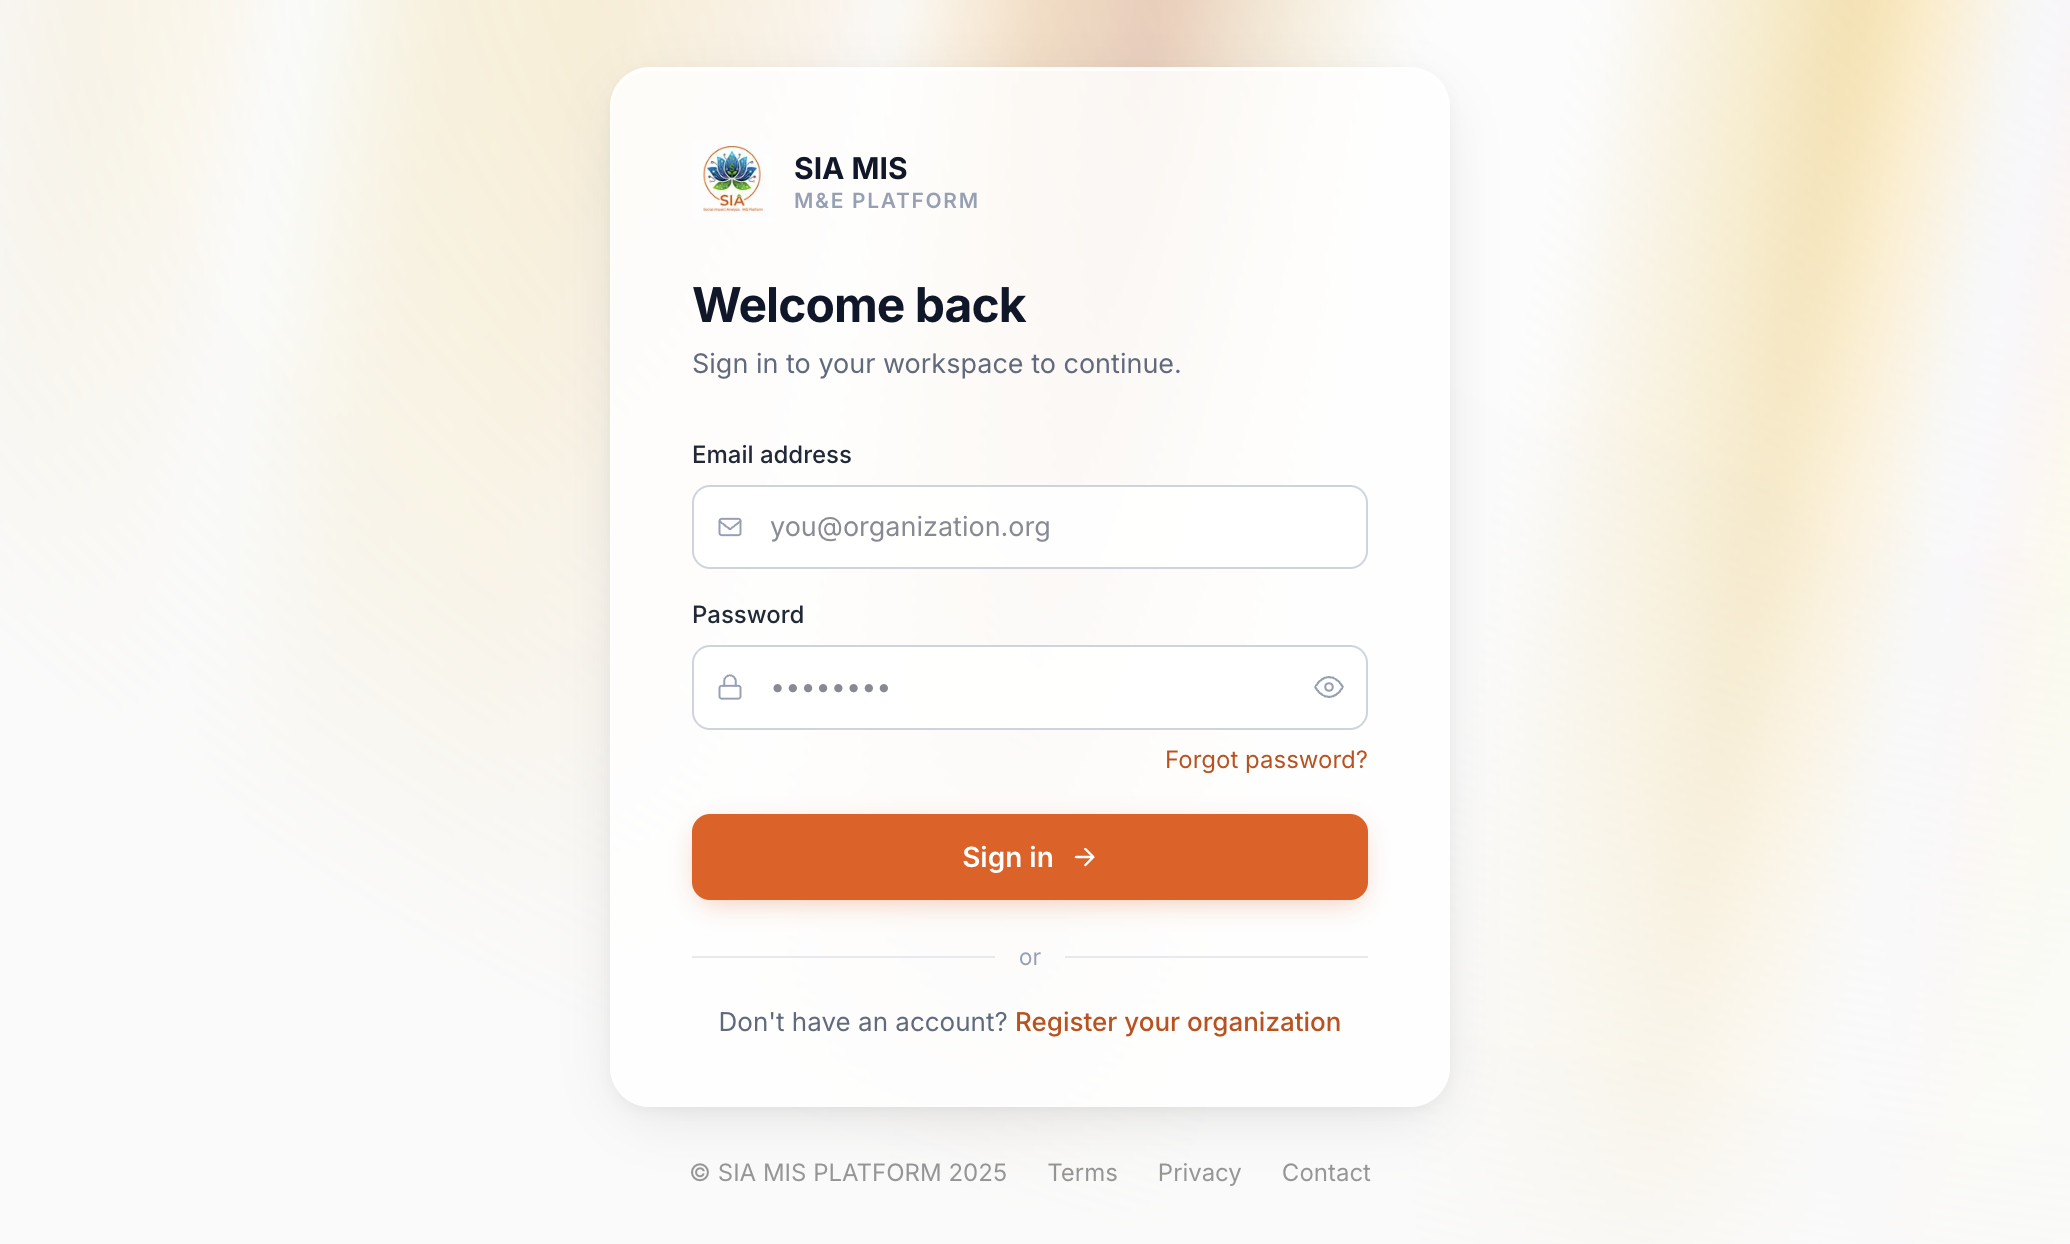
Sign in to your workspace with your verified credentials
Once your account is verified, navigate to /login and sign in with your email address and the password provided in the verification email.
| Field | Type | Description |
|---|---|---|
| Email address* | The official email used during registration. | |
| Password* | Password | Password received via verification email. Toggle visibility with the eye icon. |
After successful login you are redirected to /dashboard. Use Forgot password? to reset via email if needed.
Organization Setup
Set up your organisation profile, objectives, and indicators
The first task after onboarding is to complete your organisation profile at /dashboard/organization. This forms the foundation of your M&E framework — all subsequent programs, projects, and indicators trace back to the objectives and indicators defined here.
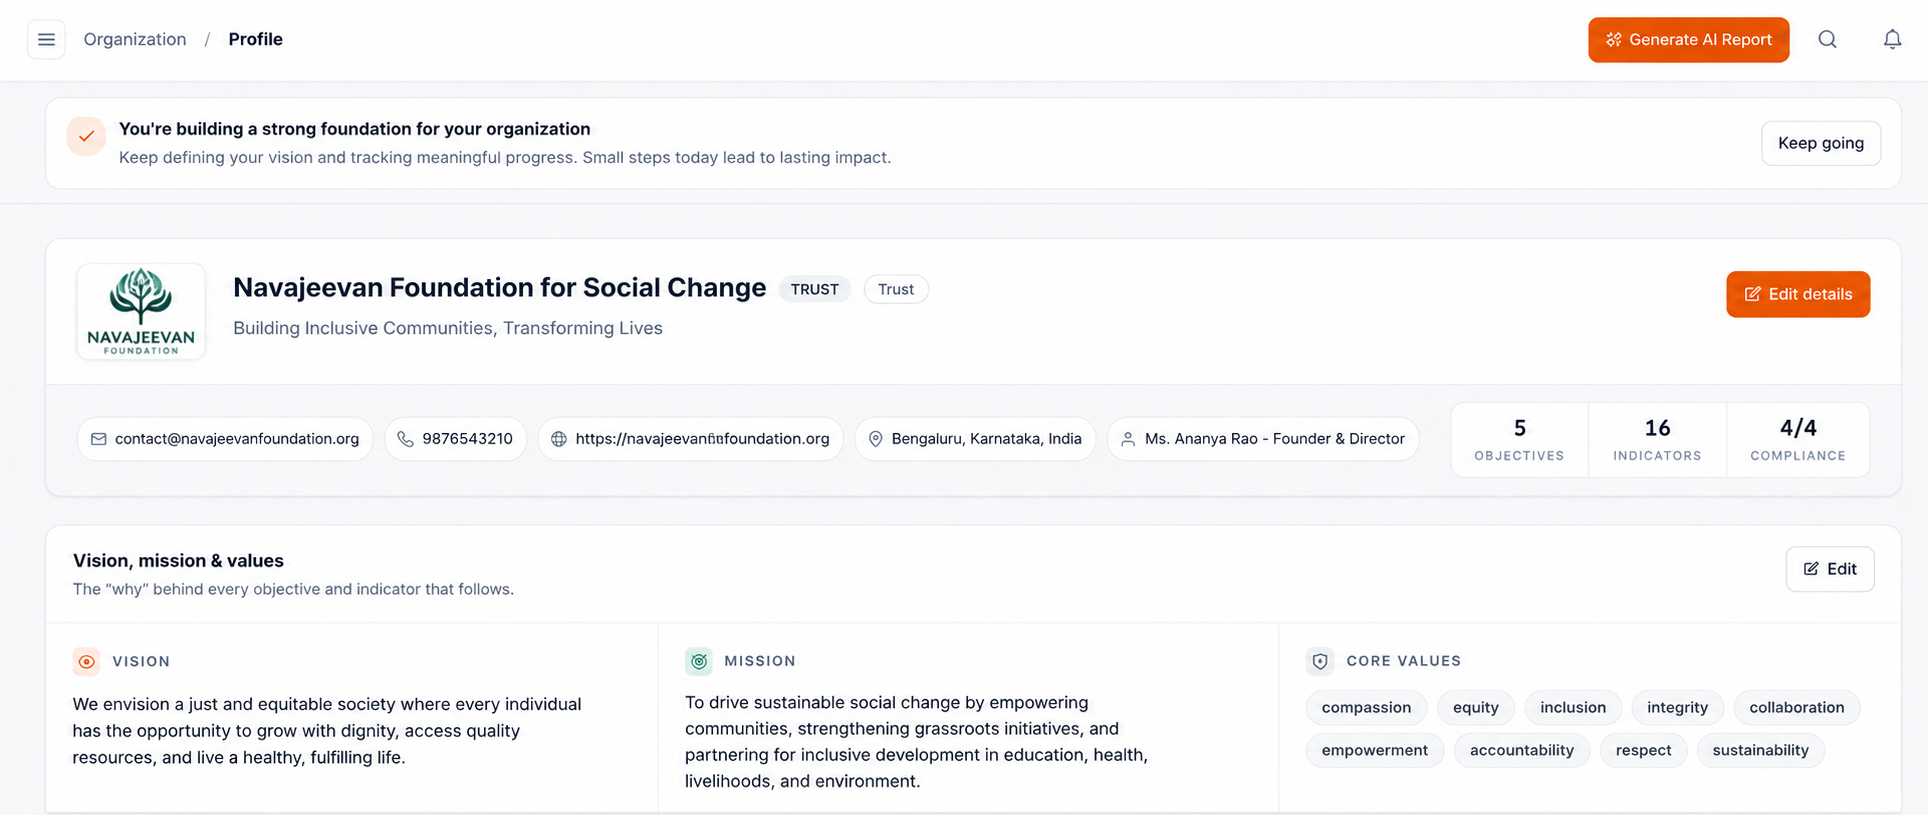
Organisation Profile
| Field | Type | Description |
|---|---|---|
| Name | Text | Legal name of the organisation. |
| Type | Select | Entity type (NGO, Trust, Foundation, etc.). |
| Logo | Image | Organisation logo displayed in the sidebar and reports. |
| Official Email | Primary contact email. | |
| Phone | Tel | Contact number. |
| Website | URL | Organisation website URL. |
| URL | LinkedIn profile URL. | |
| Address | Text | Street, city, state, and country. |
| Head of Organisation | Text | Name and title of the head. |
| Description | Textarea | Short public description. |
| History | Textarea | Background and founding history. |
| Vision / Mission | Textarea | Organisational vision and mission statement. |
| Legal Structure | Text | Registered legal structure (e.g. Section 8 Company). |
| Registration No. | Text | Official registration number. |
| PAN / TIN | Text | Tax identification numbers. |
| Certificates | Multi-check | 12A, 80G, CSR, FCRA registrations. |
Organisation Objectives
Define the outcome hierarchy for your organisation across three levels:
| Field | Type | Description |
|---|---|---|
| Description* | Textarea | What this objective aims to achieve. |
| Code* | Text | Short code for referencing (e.g. OBJ-01). |
| Level* | Select | IMPACT, OUTCOME, or OUTPUT. |
| Order Index | Number | Display order within the same level. |
Organisation Indicators
Indicators are measurable metrics linked to objectives. These become the master indicators that program and project indicators can link back to.
| Field | Type | Description |
|---|---|---|
| Name* | Text | Indicator name. |
| Type* | Select | Quantitative or Qualitative. |
| Definition | Textarea | Precise definition of what is being measured. |
| Data Source | Text | Where data is collected from (surveys, reports, etc.). |
| Frequency | Select | Reporting frequency: Monthly, Quarterly, Annual. |
| Unit | Text | Unit of measurement (e.g. number of households, %). |
| Baseline | Number | Starting value before the intervention. |
| Target | Number | Desired end value. |
Programs & LFA
Create programs with their Logical Framework Analysis (objectives and indicators)
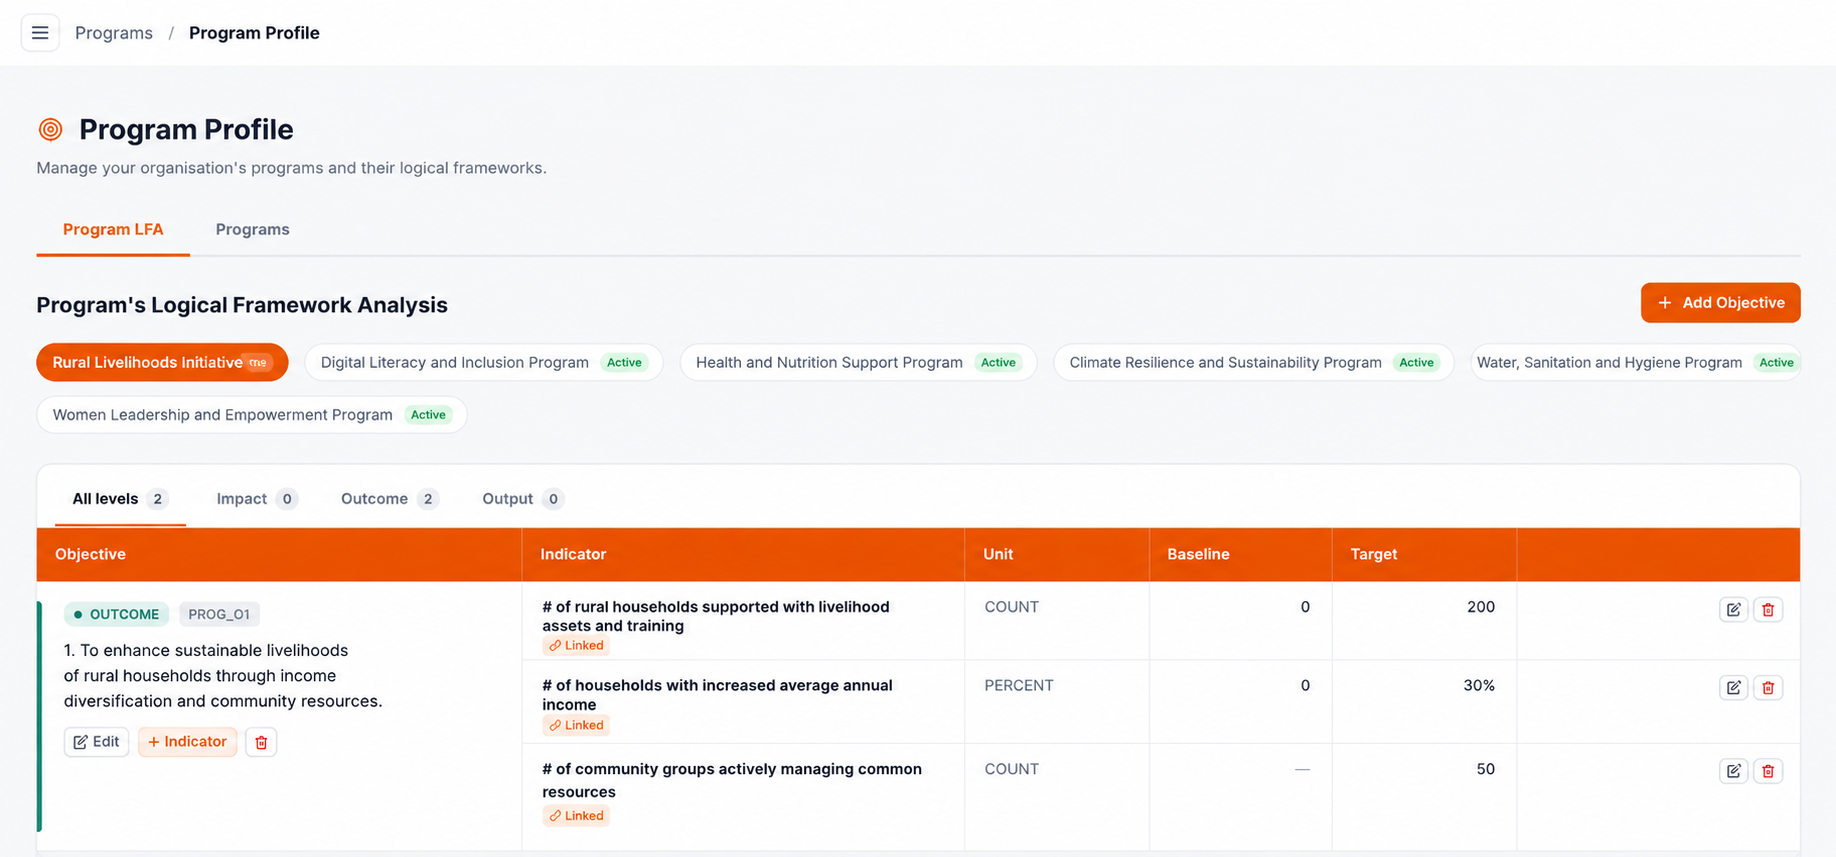
Programs are thematic groupings of work (e.g. “Livelihood Program”, “Health Program”). Each program has its own LFA: objectives at IMPACT, OUTCOME, and OUTPUT levels, with indicators per objective.
Program Details
| Field | Type | Description |
|---|---|---|
| Name* | Text | Program name. |
| Code* | Text | Short reference code. |
| Description | Textarea | Brief description of the program's purpose. |
| Sector | Select | Thematic sector (Health, Education, Livelihood, etc.). |
| Status | Select | DRAFT, ACTIVE, or COMPLETED. |
| Start Date / End Date | Date | Program duration. |
Program LFA Tab
The Program LFA tab shows three nested tables — one per objective level:
- Objectives — add IMPACT, OUTCOME, OUTPUT objectives per program (same fields as org objectives).
- Indicators per Objective — each objective can have multiple indicators linked to it.
- Link to Org Indicators — program indicators can be mapped to an organisation-level indicator, enabling roll-up reporting.
Master Interventions (viewed from Programs)
The programs page also shows a read-only table of all master interventions linked to each program, giving a quick overview of the program’s implementation strategy.
Master Interventions
Define the intervention strategies and sub-interventions for each program
Master Interventions are the core activities your organisation uses to achieve program objectives. Each intervention can have multiple sub-interventions that are directly linked to program indicators.
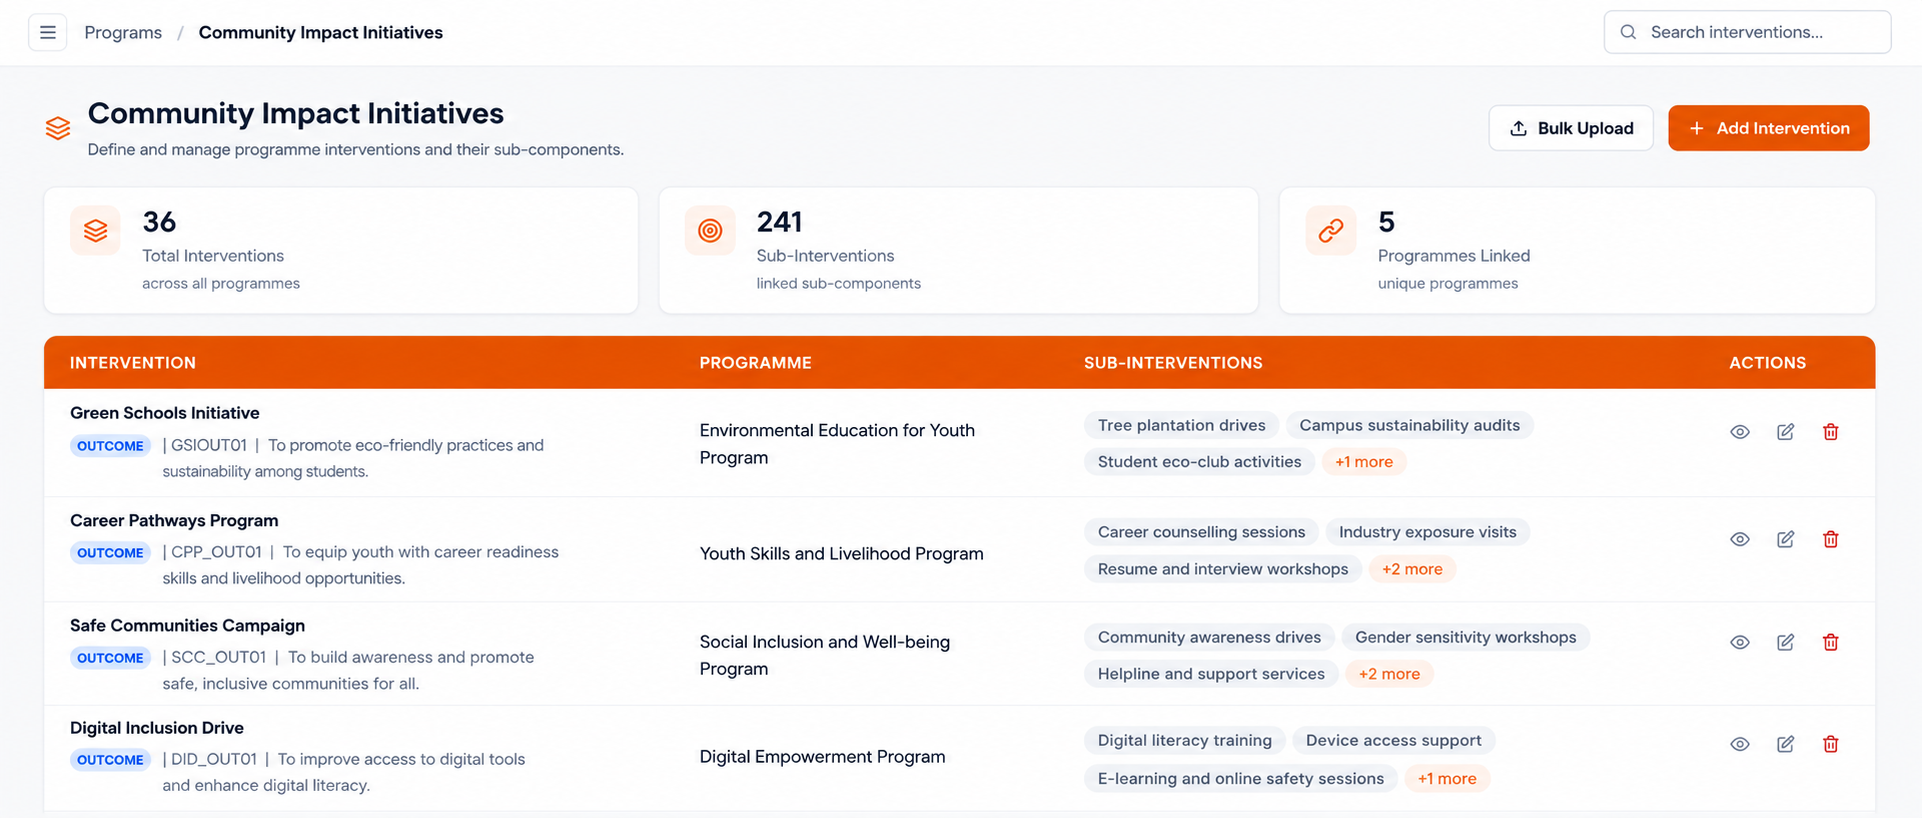
Stat Cards
Total Interventions
Count of all master interventions across programs.
Sub-Interventions
Total sub-interventions across all interventions.
Programmes Linked
Number of programs with at least one intervention.
Creating an Intervention
| Field | Type | Description |
|---|---|---|
| Program* | Select | Which program this intervention belongs to. |
| Program Objective* | Select | The objective within the program this intervention targets. |
| Intervention Name* | Text | Name of the master intervention. |
| Sub-Interventions | Repeatable | One or more sub-interventions, each with a name and a linked program indicator. |
Bulk Upload
Download the Excel template, fill in interventions and sub-interventions in bulk, and upload via the Bulk Upload button. The table supports search and pagination.
Coverage Area
Configure the geographic areas your organisation operates in
Before creating projects, set up the geographic areas at /dashboard/intervention-coverage. These areas are used to scope project work and in field reporting.
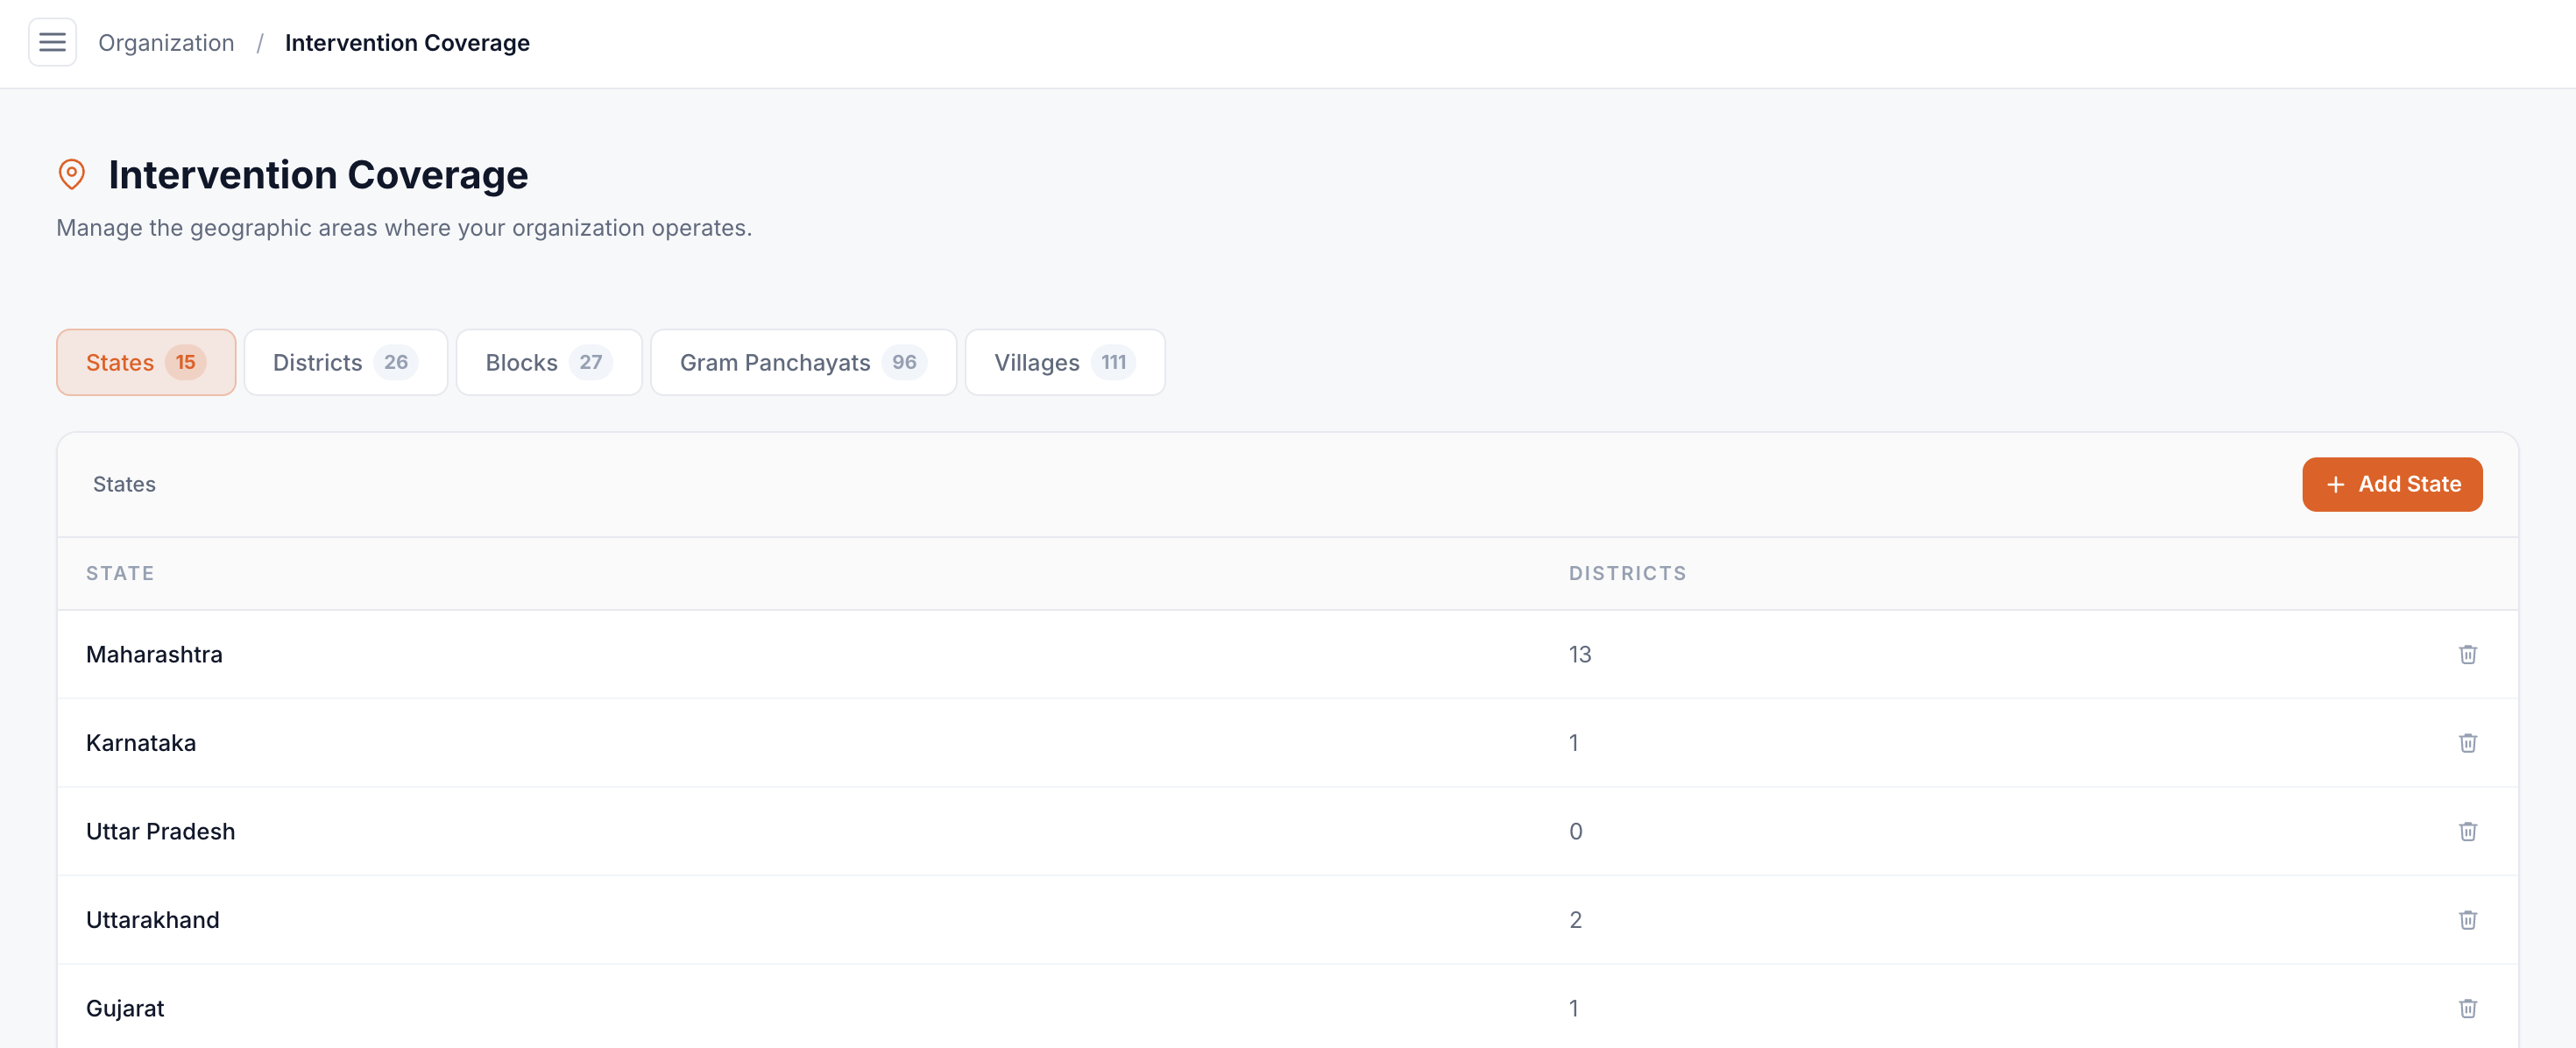
Coverage is organised in a cascading hierarchy across five tabs:
States
Districts
Blocks
Gram Panchayats
Villages
Each level uses searchable dropdowns that cascade from the level above. For example, Districts are filtered by the selected State. Areas added here appear as options in project area forms and report location selectors.
Donors
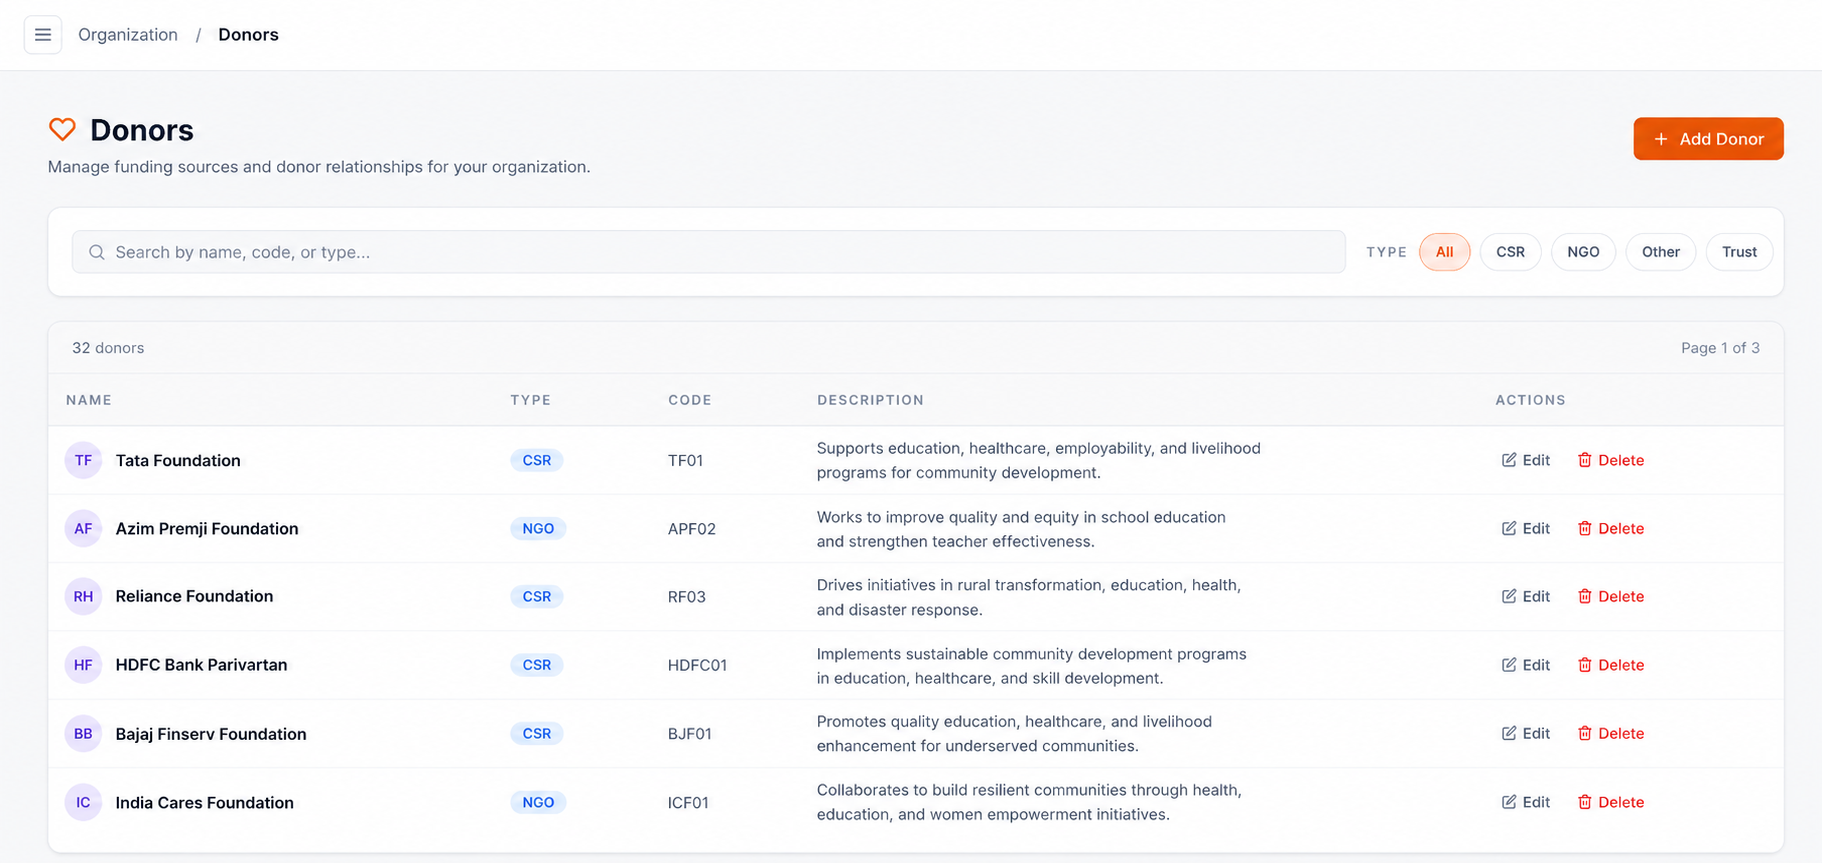
Register funding organisations that support your projects
Donors are registered at /dashboard/donors and linked to projects in the funding tab. This enables granular funding-source tracking per project.
| Field | Type | Description |
|---|---|---|
| Name* | Text | Donor name. |
| Type* | Select | CSR, Government, Trust, Foundation, Individual, International, Multilateral, or Other. |
| Code | Text | Optional short reference code. |
| Description | Textarea | Optional notes about the donor. |
The table supports full-text search and filter chips by donor type. Donors can be edited or deleted. Pagination handles large donor lists.
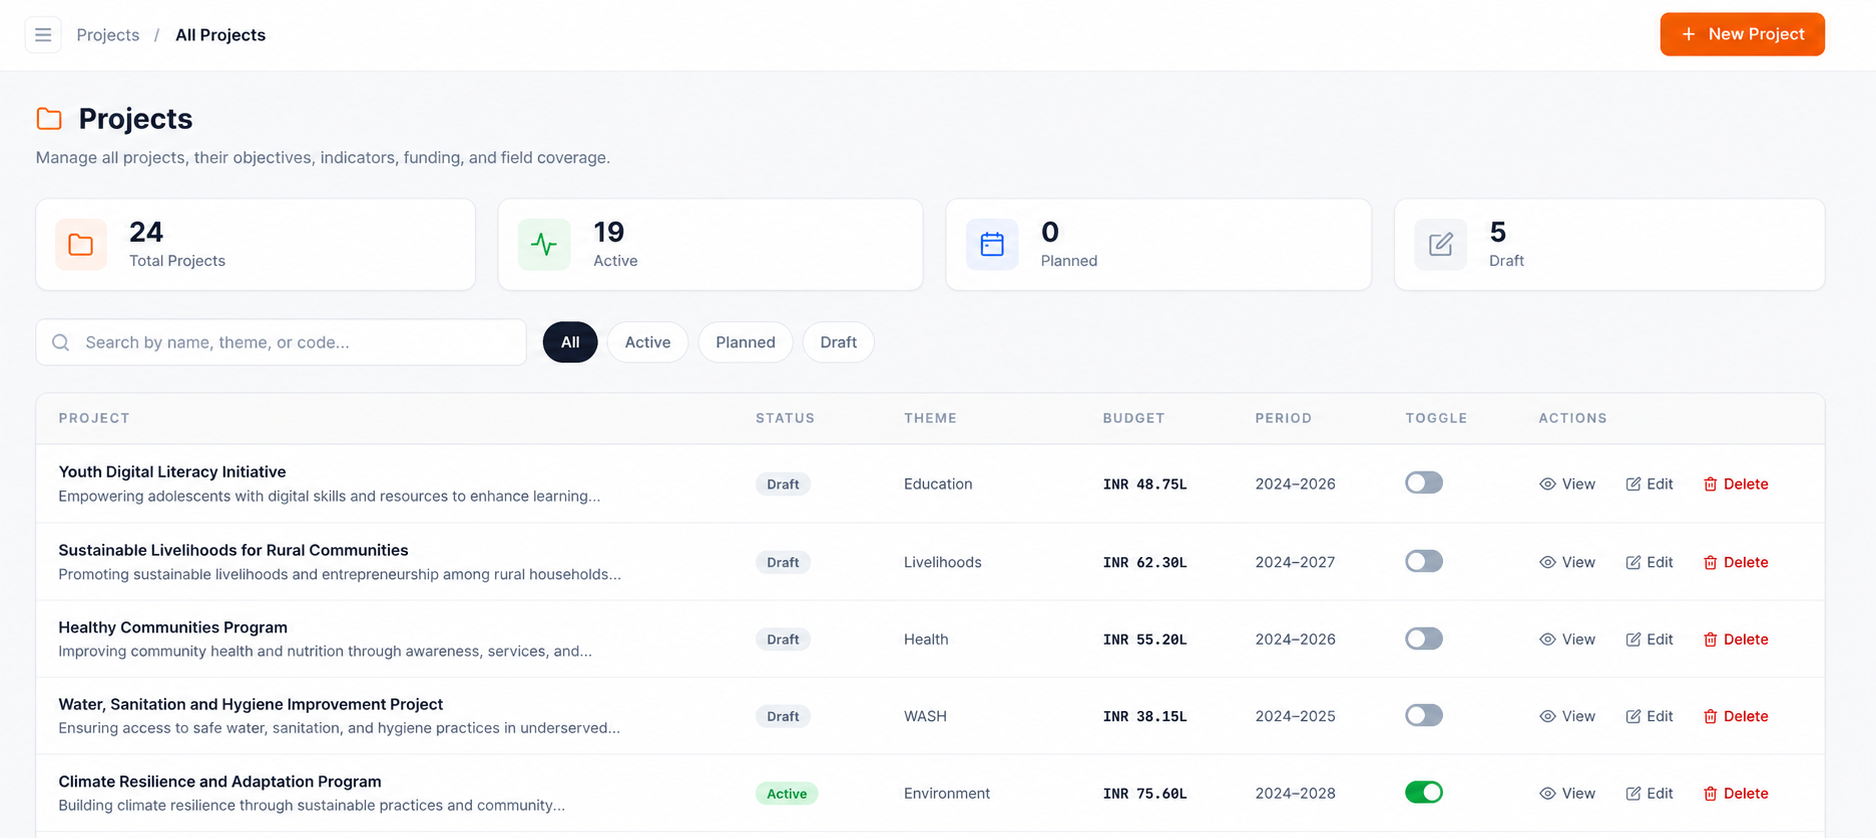
Projects
Create and manage funded projects with full LFA, teams, and coverage areas
Projects are the primary operational unit at /dashboard/projects. A project form has six tabs covering all aspects of project planning.
Tab 1 — Basic Info
| Field | Type | Description |
|---|---|---|
| Project Name* | Text | Full project name. |
| Project Code* | Text | Unique reference code. |
| Description | Textarea | Narrative summary of the project. |
| Theme | Text | Thematic focus area. |
| Status* | Select | DRAFT, PLANNED, or ACTIVE. |
| Total Budget* | Number | Total approved project budget. |
| Currency* | Select | INR, USD, EUR, or GBP. |
| Start Date / End Date* | Date | Project duration. |
| Direct Beneficiaries | Number | Number of direct beneficiaries targeted. |
| Indirect Beneficiaries | Number | Number of indirect beneficiaries. |
| Goal | Textarea | Overall project goal statement. |
Tab 2 — Objectives
Define project-level IMPACT, OUTCOME, and OUTPUT objectives. Fields mirror program objectives (description, code, level). Objectives created here are used to scope project indicators and activity plans.
Tab 3 — Indicators
Add measurable indicators linked to project objectives. Each indicator can be further linked to a program indicator (which in turn links to an org indicator) for roll-up reporting. Fields: name, type, definition, data source, frequency, unit, baseline, target.
Tab 4 — Funding
Link one or more donors to this project with the amount and currency.
| Field | Type | Description |
|---|---|---|
| Donor* | Select | Select from previously registered donors. |
| Amount* | Number | Funding amount from this donor. |
| Currency | Select | Currency of the grant/donation. |
Tab 5 — Team
Assign organisation members to the project with defined roles (Project Manager, M&E Officer, Field Agent, etc.). Team members can later file reports and view project data.
Tab 6 — Areas
Select the geographic intervention areas for this project using cascading dropdowns: State → District → Block → Gram Panchayat → Village. Only areas previously added in the Coverage Area section are available.
Activity Plans
Plan field activities with monthly targets, costs, and geographic focus
Activity Plans are created at /dashboard/project-plans and represent structured work items within a project. They capture what activity will be done, where, by when, and what resources are required.
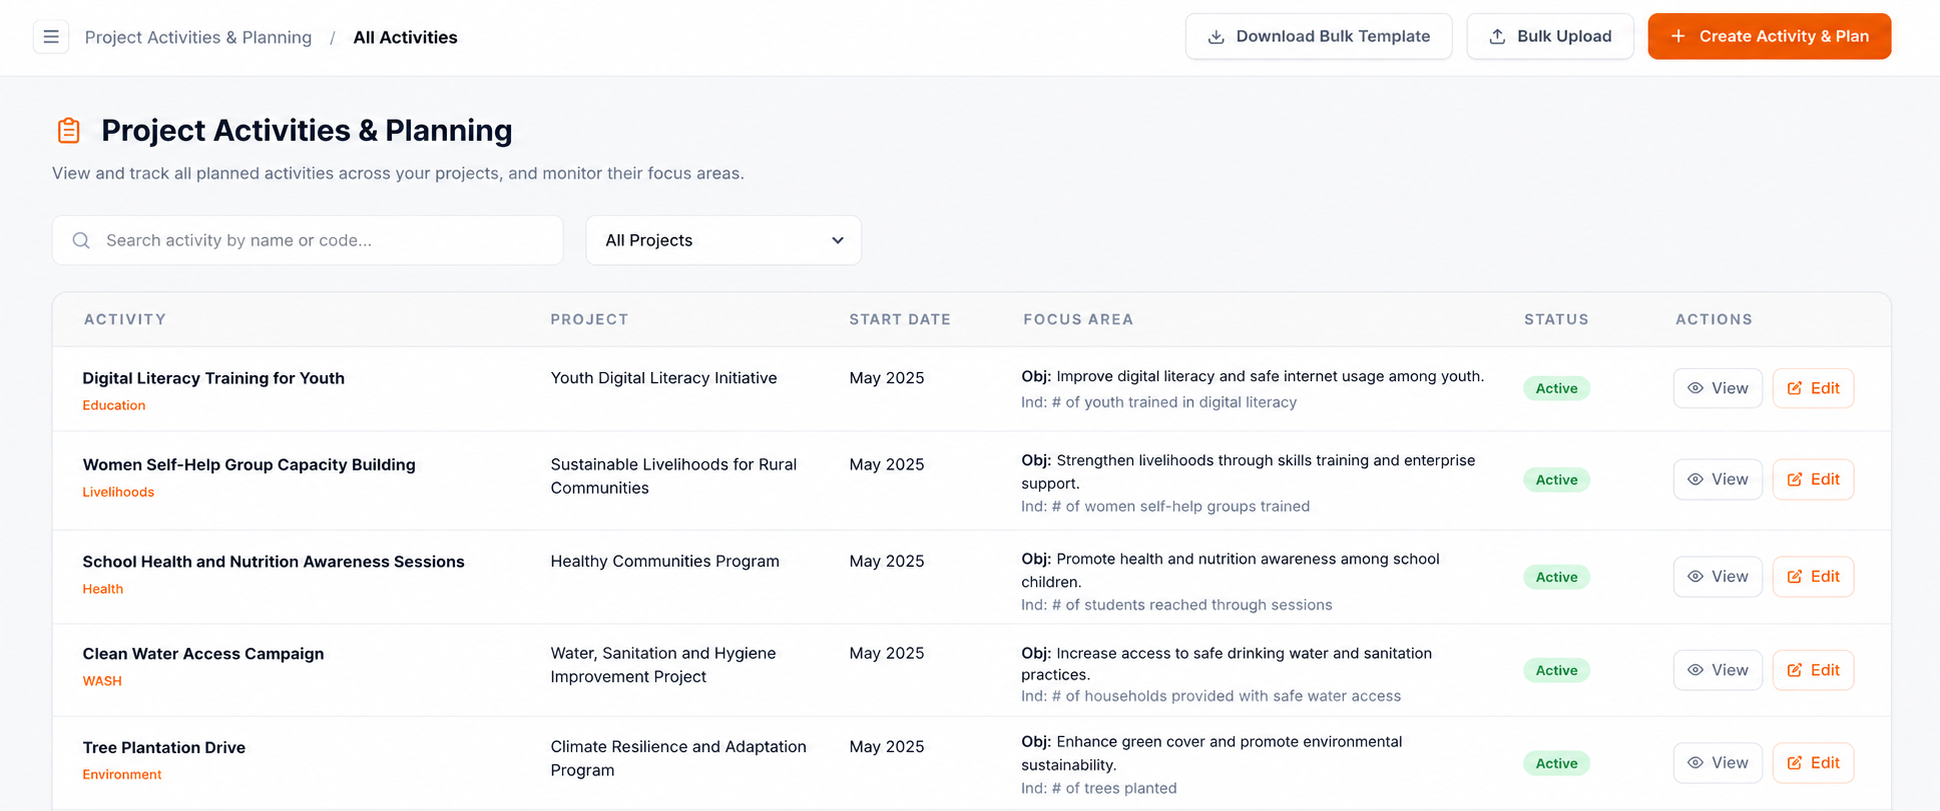
Activity Plan List Features
- Search by activity name or code.
- Filter by project from a dropdown.
- Download Bulk Template — Excel template for mass-importing plans.
- Bulk Upload — Upload filled-in Excel template.
- Table columns: Activity (name + code + type badge), Project, Start Date, Focus Area (objective + indicator), Status.
Activity Types
Generic activities not captured by other types.
Training, workshops, capacity-building events.
Household-level surveys or benefit delivery.
Construction, installation, physical assets.
Creating an Activity Plan
| Field | Type | Description |
|---|---|---|
| Project* | Select | The project this activity belongs to. |
| Objective* | Select | Project objective this activity contributes to. |
| Indicator* | Select | Specific indicator being tracked by this activity. |
| Intervention* | Select | Master intervention (cascades from program → objective). |
| Sub-Intervention* | Select | Specific sub-intervention under the master intervention. |
| Intervention Area* | Select | Geographic area from the project's coverage areas. |
| Activity Name* | Text | Name of this specific activity. |
| Activity Type* | Select | GENERAL, TRAINING, HOUSEHOLDS, or INFRASTRUCTURE. |
| Level of Intervention* | Select | Geographic level: State, District, Block, Gram Panchayat, or Village. |
| Start Date / End Date* | Date | Activity duration. |
| Target Unit | Number | Total planned output units. |
| Cost Per Unit | Number | Budget per unit of output. |
| Unit of Measure | Text | What the unit represents (e.g. 'persons trained'). |
| Leverage | Text | Any leveraged resources or co-funding. |
| Link Program Indicator | Toggle | Optionally link this activity directly to a program-level indicator. |
Monthly Target Grid
Once basic details are filled, a month-by-month target grid appears for every month within the activity’s date range. Enter the planned output for each calendar month. The total across all months must reconcile with the overall Target Unit.
Reports
File field reports against activity plans with participant data and attachments
Reports are filed at /dashboard/reports. Each report records what actually happened in the field — participants, households benefited, geographic location, and supporting documents — against a planned activity.
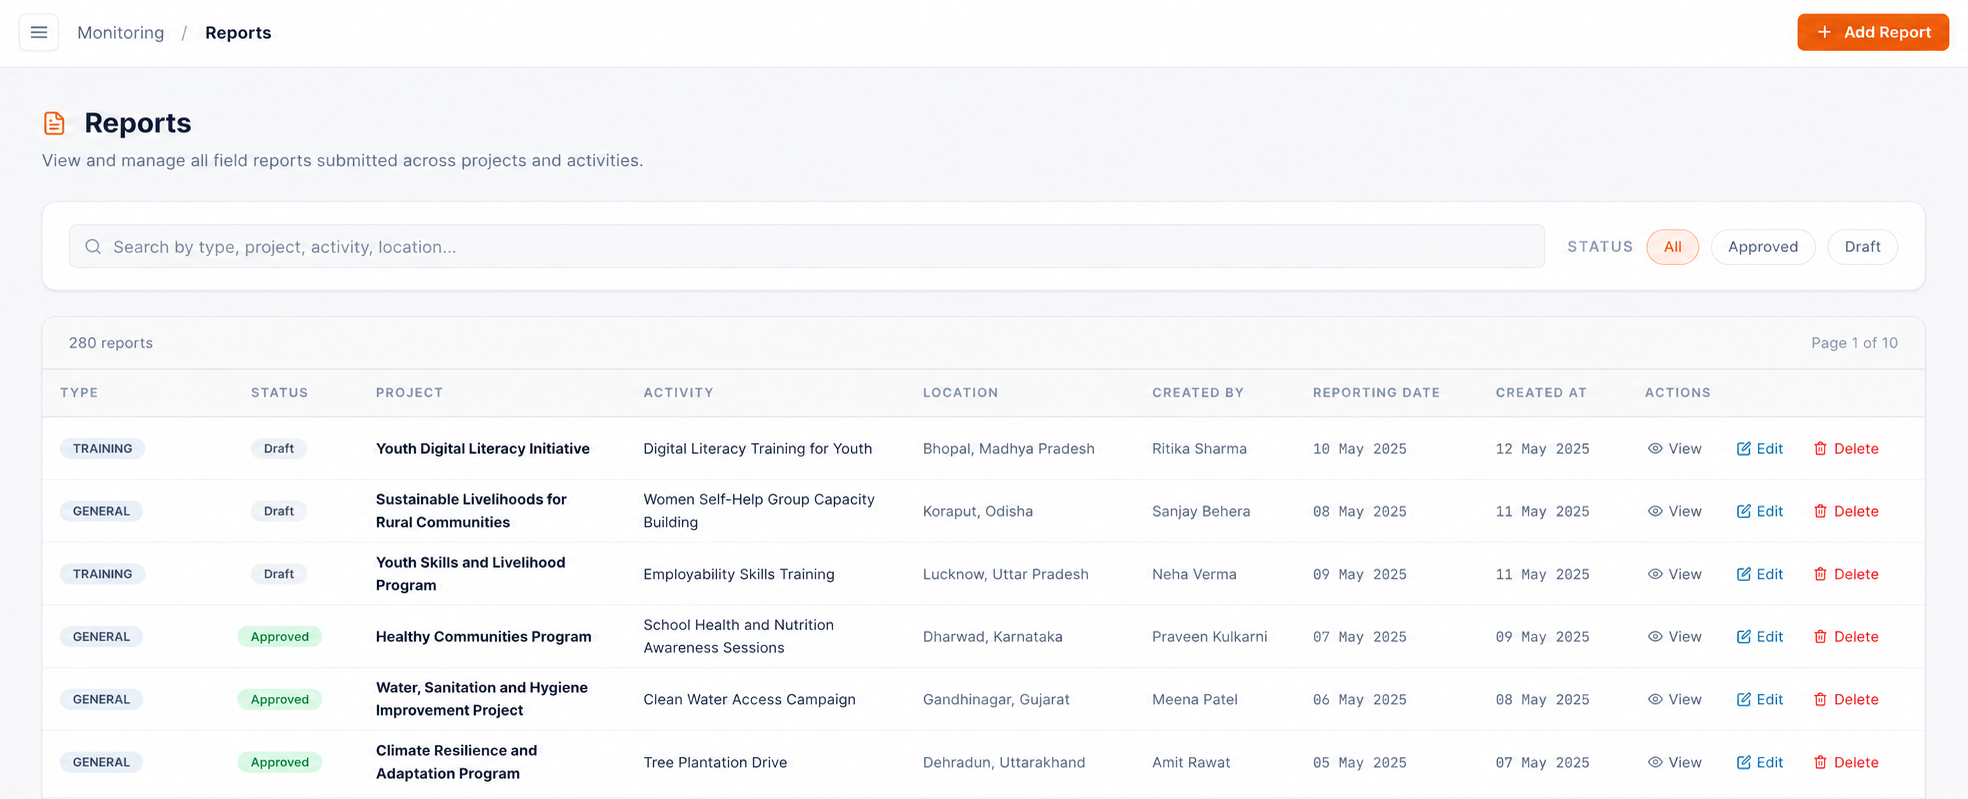
Report Status Flow
Reports can be saved as DRAFT before submission. Rejected reports show the rejection reason and can be revised and resubmitted.
Report Fields — Activity & Location
| Field | Type | Description |
|---|---|---|
| Project* | Select | The project this report is filed against. |
| Intervention* | Select | Master intervention (filtered by project). |
| Sub-Intervention* | Select | Sub-intervention under the master intervention. |
| Area* | Cascading | Geographic location: State → District → Block → Gram Panchayat → Village. |
| Month* | Select | Reporting month (current month, or previous month if within first 7 days). |
| Quarter | Auto | Auto-computed from the selected month (Q1–Q4). |
| Financial Year | Auto | Auto-computed financial year (e.g. FY24-25). |
Report Fields — Participants
Participants can be added via three methods:
Manual Entry
Add each participant individually with full profile fields.
Youth Bank
Search and select from the organisation's People Bank (pre-registered individuals).
Excel Upload
Download template, fill participants, and bulk-upload.
| Field | Type | Description |
|---|---|---|
| Name* | Text | Participant full name. |
| Age | Number | Age in years. |
| Gender | Select | Male, Female, or Other. |
| Education | Select | Highest level of education attained. |
| Social Group | Select | SC, ST, OBC, General, or Other. |
| Designation | Text | Job title or role. |
| Organisation | Text | Employer or affiliated organisation. |
| Mobile | Tel | Contact number. |
| Email address. | ||
| Is PwD | Checkbox | Person with Disability flag. |
Report Fields — Household Benefits
| Field | Type | Description |
|---|---|---|
| Benefit Name* | Text | Name of the benefit provided (e.g. 'Solar Lamp'). |
| Unit Type* | Select | Type of unit (number, kg, set, etc.). |
| Reported Number* | Number | Actual quantity delivered/provided. |
File Attachments
Attach supporting evidence — photographs (JPG/PNG) and documents (PDF). Multiple files can be uploaded per report. Files are stored on Cloudinary and linked to the report record.
Analytics
Visualise activity performance, indicator progress, and the organisation hierarchy
SIA MIS provides three dedicated analytics views. Each aggregates data from reports and activity plans to surface insights for M&E decision-making.
Activity Analytics — /dashboard/activity-analytics
Tracks planned vs. achieved activity output across projects and programs.
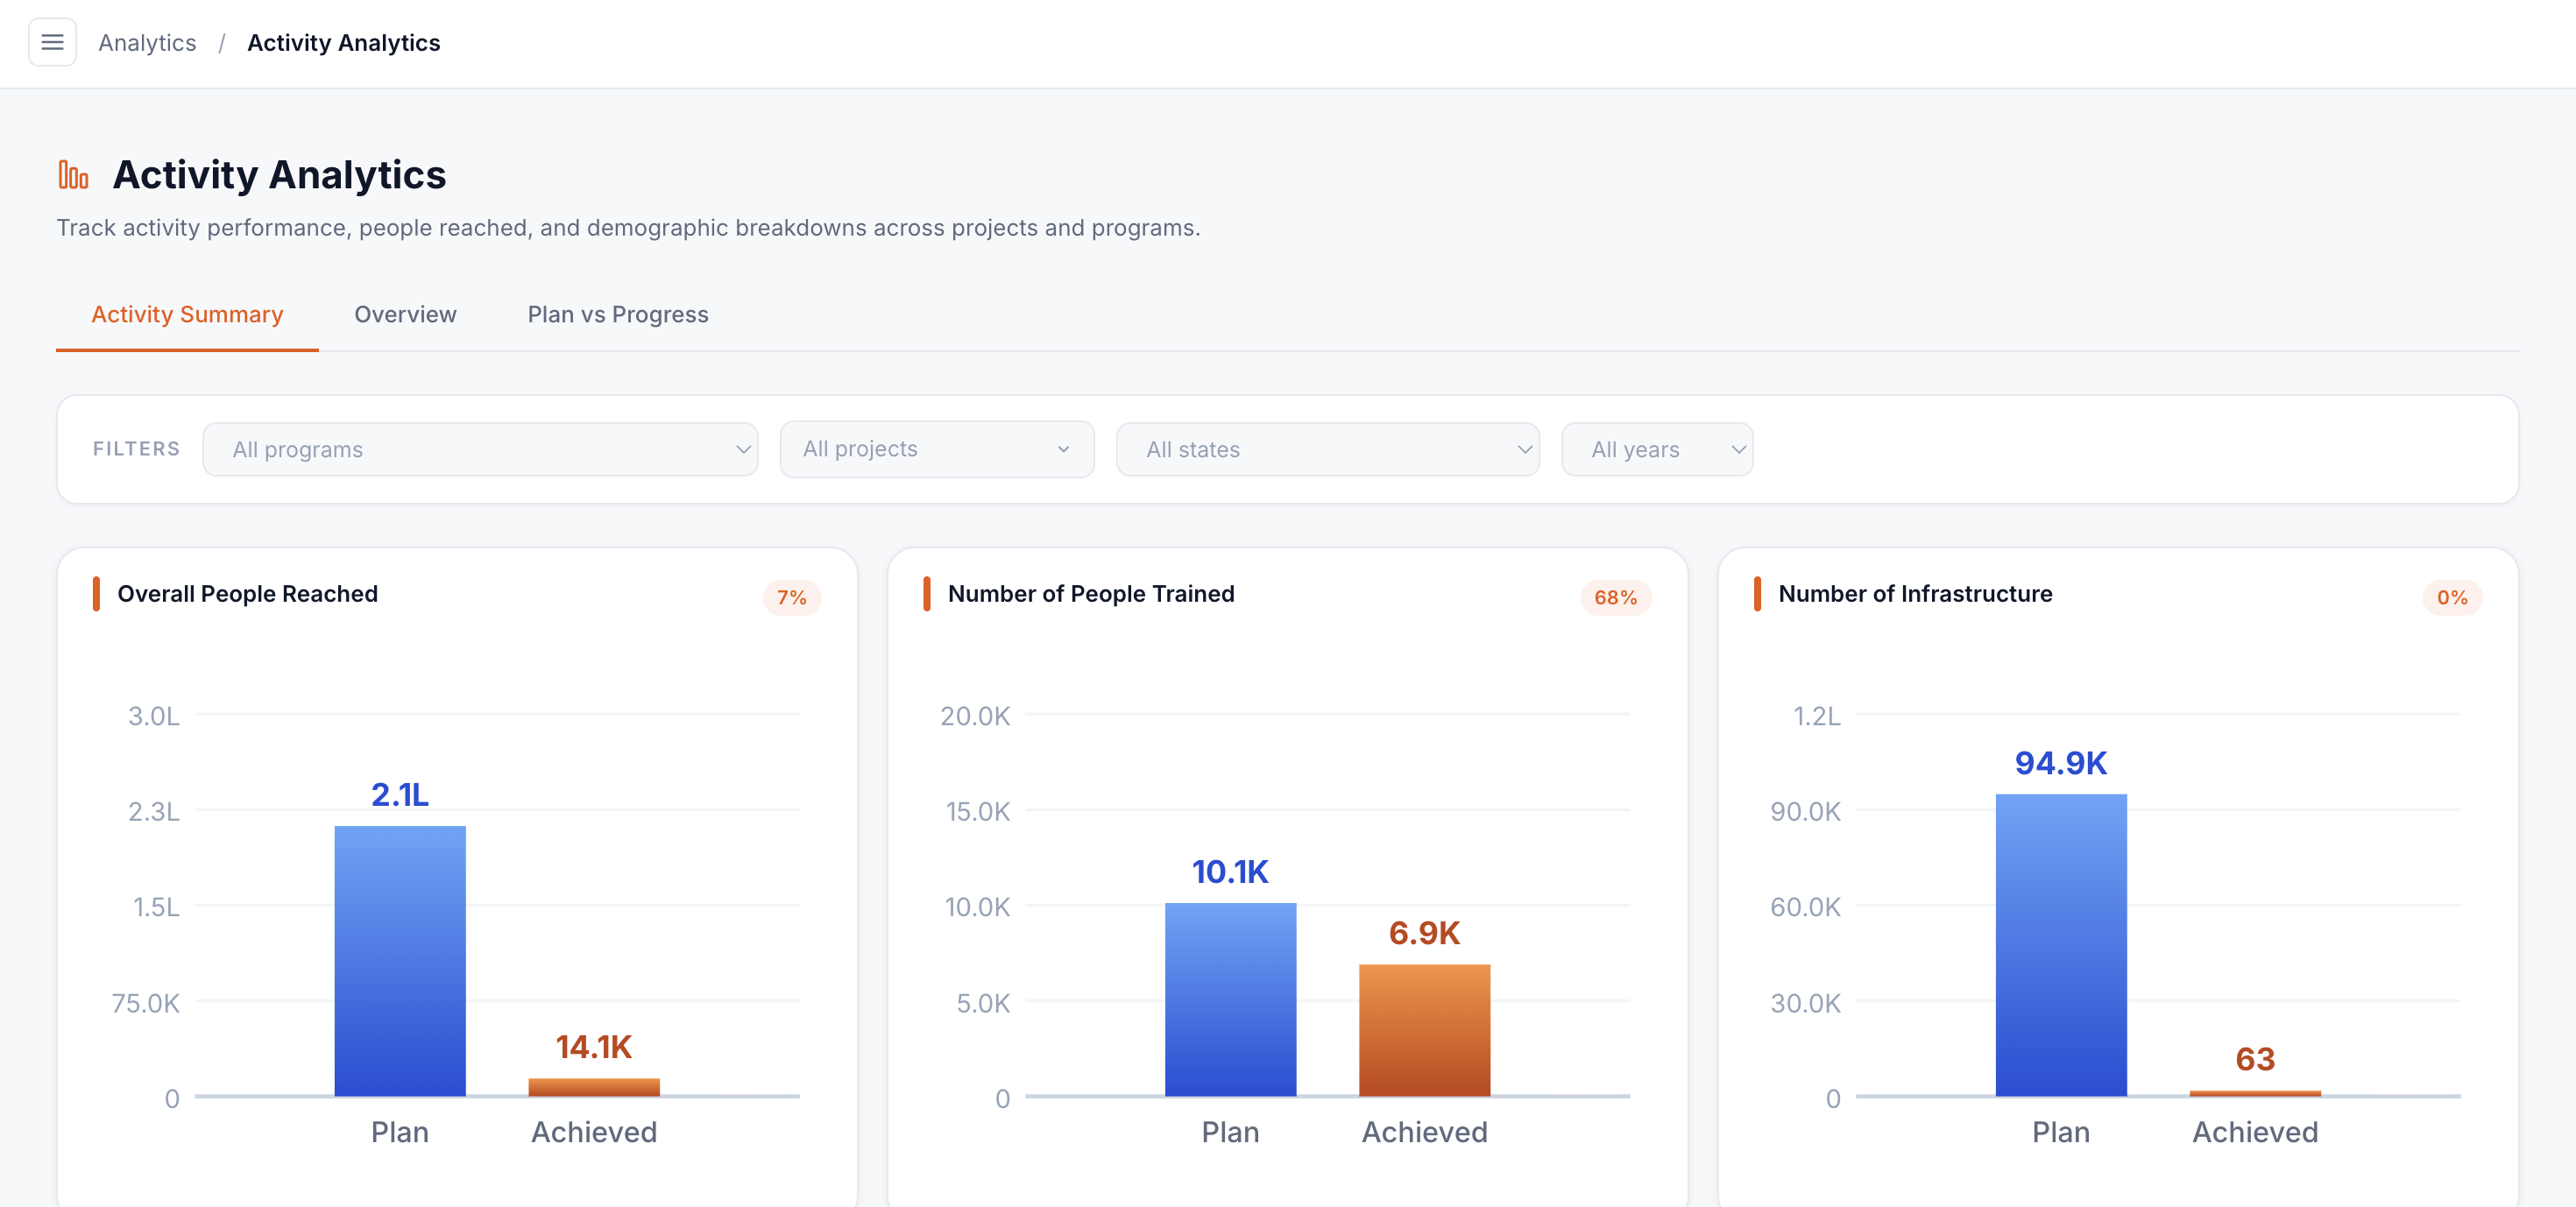
Overall Plan vs Achieved
Total planned output vs. total reported output across all activity types.
Training Activities
Plan vs. achieved specifically for TRAINING-type activities.
Infrastructure
Plan vs. achieved for INFRASTRUCTURE-type activities.
Activity Bar Chart
Month-by-month bar chart of planned and actual activity output.
Activity Distribution
Donut chart showing breakdown of activity output by type (General / Training / Household / Infrastructure).
Gender Distribution
Donut chart of participant gender breakdown across all reports.
Social Group Distribution
Donut chart of participant social group breakdown (SC/ST/OBC/General/Other).
Filters: Financial Year, Program (dropdown), Project (searchable dropdown), State (dropdown).
Organisation Tree — /dashboard/organization-tree
Visualises the linkage between organisation-level indicators and program-level indicators — the indicator hierarchy that underpins all roll-up reporting.
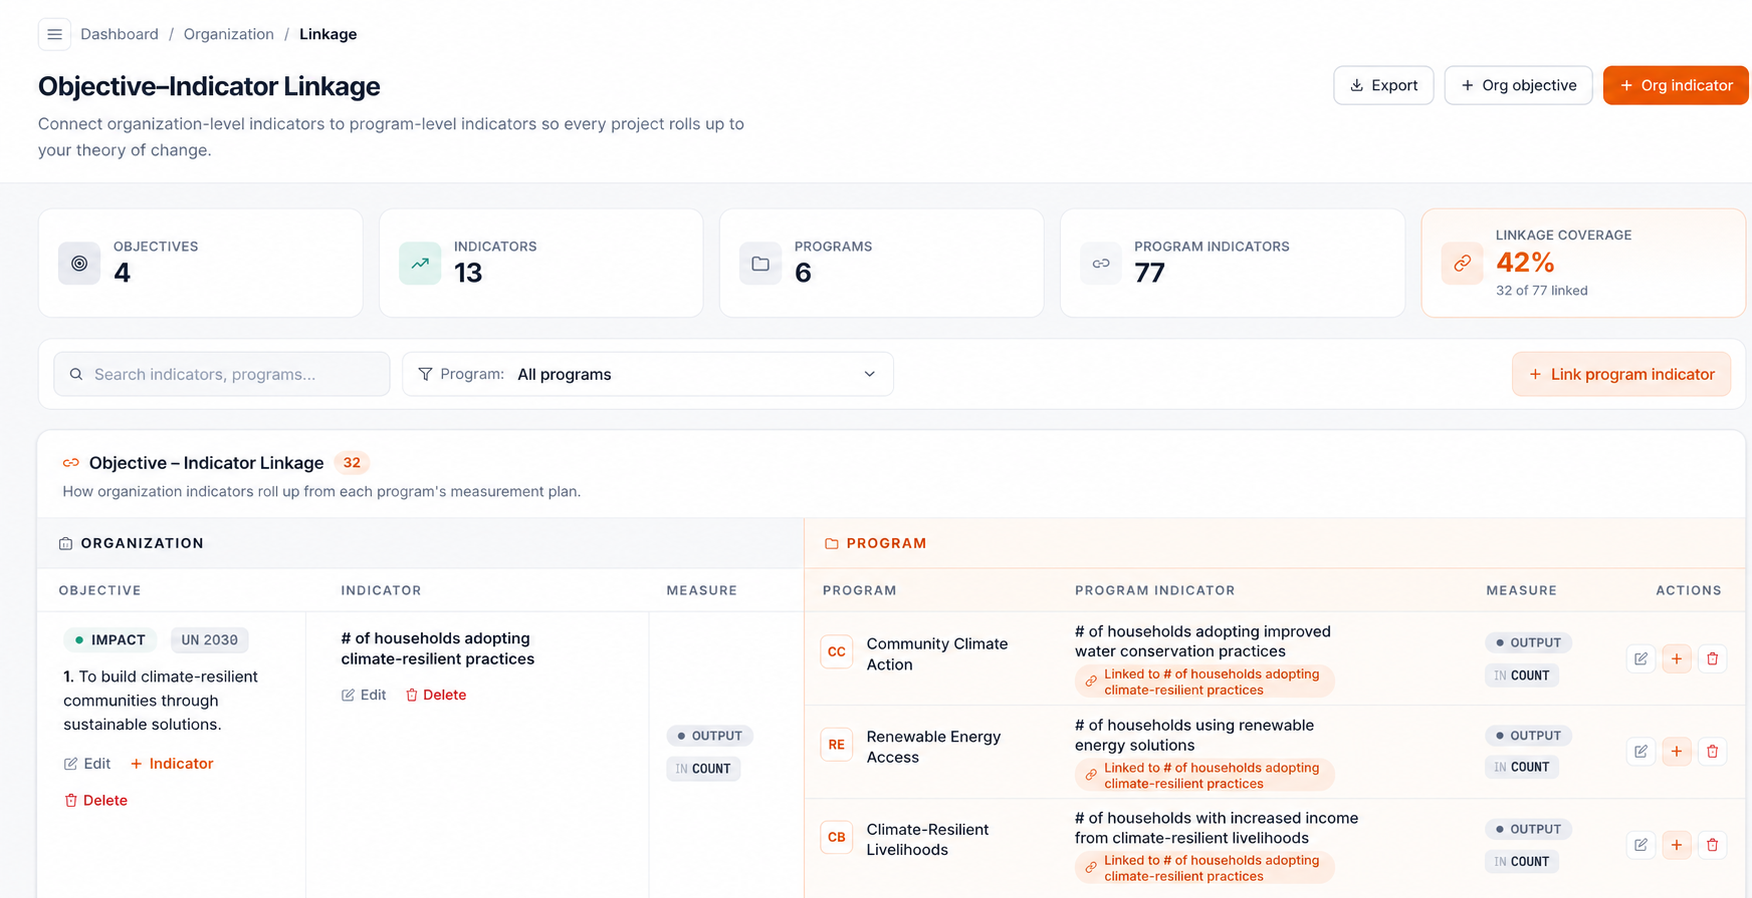
The page has two panels:
Org Indicators
Lists all organisation-level indicators grouped by objective level (IMPACT / OUTCOME / OUTPUT). Each indicator can be linked to program indicators from the same view.
Program Indicators
Lists program-level indicators and shows which org indicator each is mapped to. Unmapped indicators are flagged, prompting the user to complete the linkage.
Indicators Dashboard — /dashboard/indicators
Shows progress toward targets for every indicator as a visual progress bar, grouped by objective level.
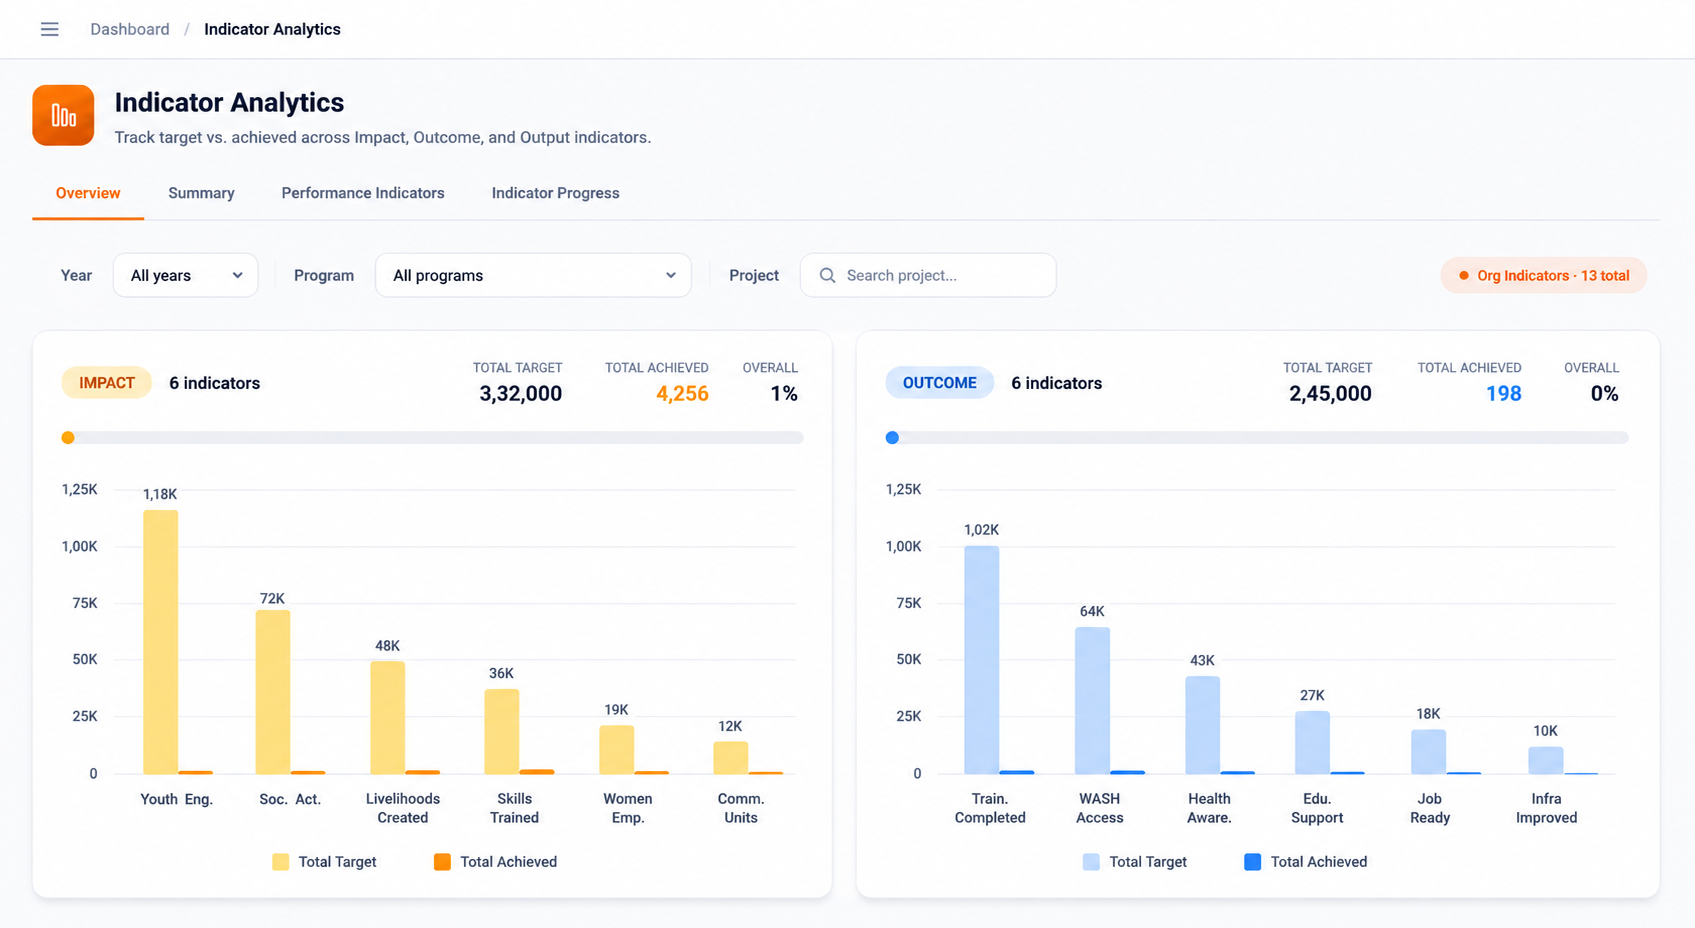
| Field | Type | Description |
|---|---|---|
| Year Filter | Select | Filter data by financial year. |
| Program Filter | Select | Scope to a specific program. |
| Project Filter | Select | Scope to a specific project. |
| Mode | Toggle | Switch between Org, Program, or Project level indicator views. |
Each indicator card shows the baseline, target, and current achieved value with a colour-coded progress bar. IMPACT indicators are shown at the top, followed by OUTCOME and OUTPUT.